Google Search Console Rolls Out Weekly & Monthly View Update in Performance Reports
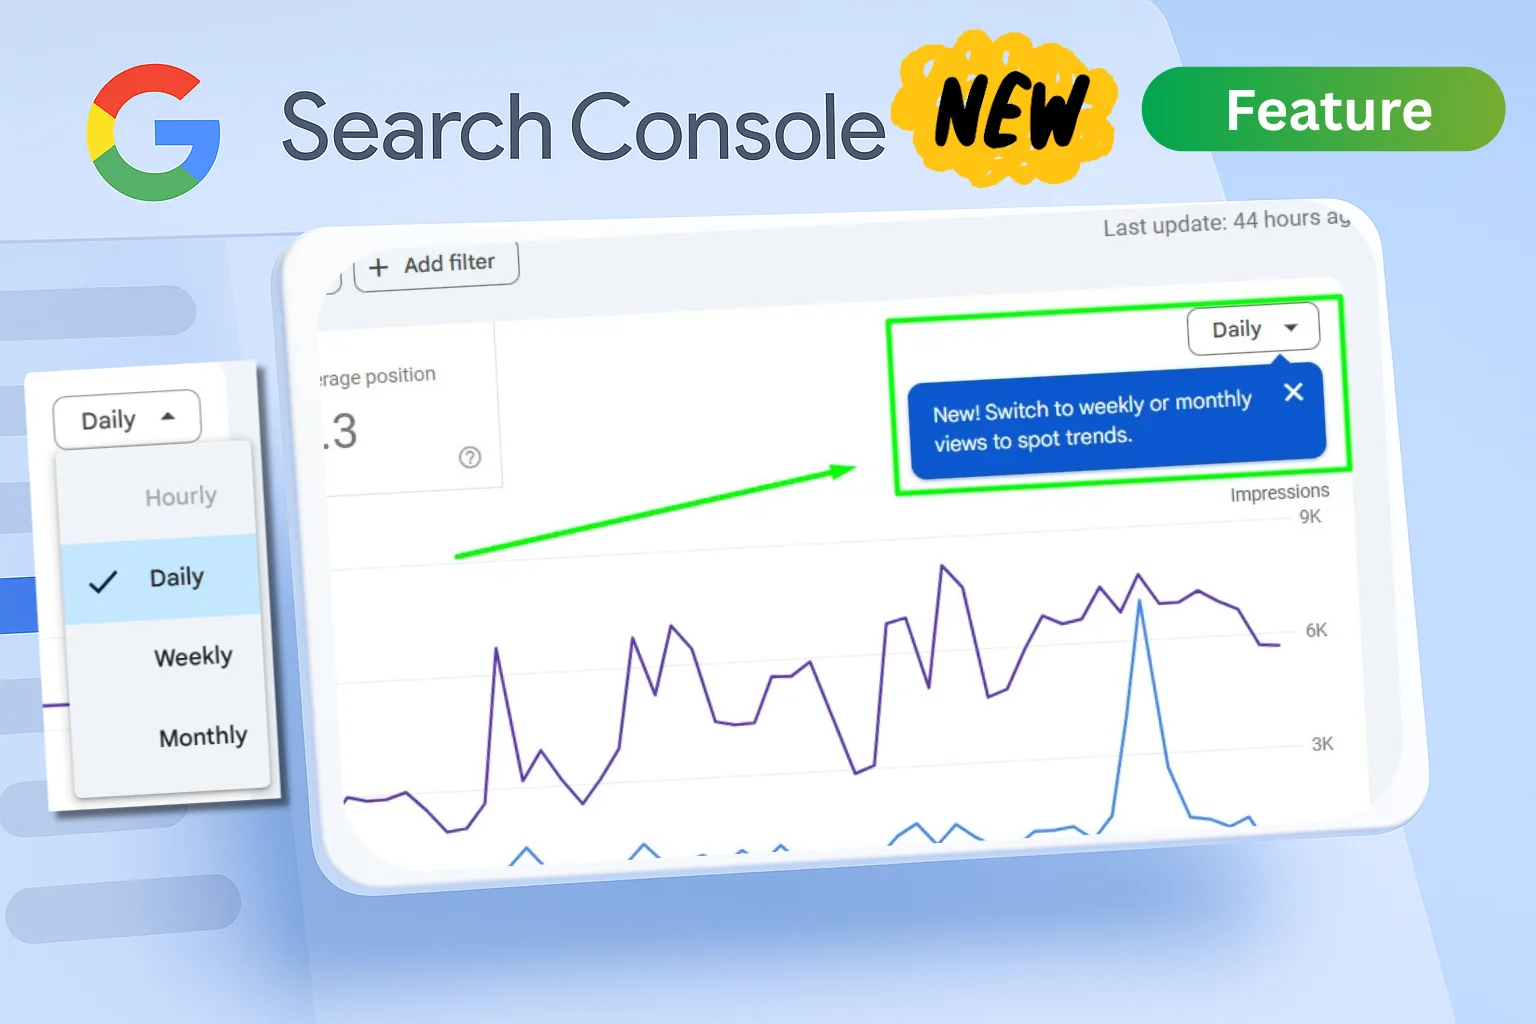
Google has released a new update inside Search Console → Performance → Search Results, introducing an additional dropdown to view data in Hourly, Daily, Weekly, and Monthly formats. The change appeared today with an on-screen popup notification, indicating that the feature is designed to make trend identification easier.

What Has Changed in Search Console
Until now, the performance graph relied entirely on daily aggregation. This often produced sharp fluctuations that made analysis inconsistent and created confusion during natural ups and downs in rankings. With the new update, users can toggle between weekly and monthly views directly inside the chart, without exporting data to external tools. The selector is visible at the top-right side of the graph, next to performance metric filters.

Why This Update Matters for SEO
The new view modes help reduce noise caused by daily volatility and make the long-term trend more visible. Instead of reacting to short-term click drops, the weekly and monthly views provide a stable picture of whether performance is improving, declining, or remaining consistent. It becomes easier to evaluate the effect of indexing improvements, content updates, backlink campaigns, seasonal demand, and Google Core Updates because the trend is displayed in a structured way instead of day-to-day swings.

Benefits for Reporting and Analysis
The update significantly simplifies reporting for agencies, analysts, and website owners. Graphs now present a clearer narrative that can be shared with clients and teams without requiring spreadsheets, manual grouping, or custom dashboards. The weekly and monthly trend lines translate performance into meaningful insights that were previously hidden under daily fluctuation. As a result, long-term decision-making becomes more reliable.
Rollout Status
The feature is already visible in multiple accounts, including small, medium and enterprise websites, suggesting that this is not a limited experiment. Google has not yet published an official blog announcement, but the in-product notification confirms it as a permanent addition. Wider visibility is expected over the coming days as the rollout completes globally.
Overall Impact
This update does not influence ranking signals, crawling, or indexing. However, it strongly improves the usability of performance data. Search Console now moves closer to advanced analytics tools by offering a format where growth patterns can be interpreted more accurately. The new data presentation is expected to become a standard part of performance tracking in SEO.
FAQ
Google has added a dropdown to switch between Hourly, Daily, Weekly, and Monthly view formats in the Performance chart to help users identify trends more easily.
Weekly and monthly views reduce daily data volatility and provide a clearer picture of long-term performance, making it easier to evaluate SEO improvements and search demand changes.
Yes, the feature has started appearing in multiple accounts globally and is expected to reach all properties soon.
No. The update only changes how performance data is displayed; it does not impact crawling, indexing, or ranking algorithms.
The Weekly and Monthly view selector is located at the top-right of the Performance graph, next to metric filters such as clicks, impressions, CTR, and average position.
Author
Harshit Kumar is an AI SEO Specialist with 7+ years of experience in search engine optimization, automation-based SEO strategies, technical growth frameworks, and data-driven ranking systems. He is known for consistent SEO case studies, update-tracking articles, and practical implementation research focused on real-world results rather than theory. Through kumarharshit.in, he reports Google algorithm changes, new SEO features, and industry developments with accuracy and field-tested insights.


Helpful information with easy explanations that I could not find anywhere else.